Viewing the Virtual Guest Impact Analysis and Recommendation Report
Viewing the Virtual Guest Impact Analysis and Recommendation Report
#380690
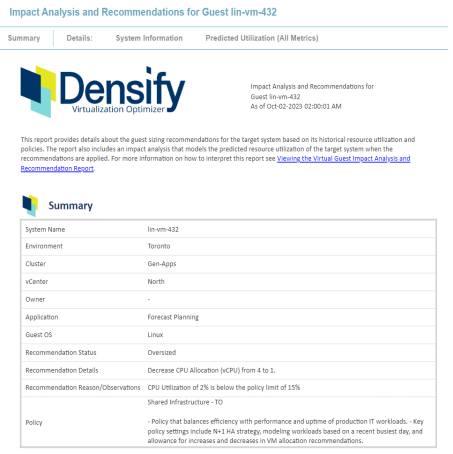
The Virtual Guest Impact Analysis and Recommendation report allows you to review details and impact assessment for a specific virtual guest, before implementing Densify's guest sizing recommendations. Specifically, the report provides:
- Optimization Reasoning—the data and the policy settings that resulted in the resource allocation recommendations being made;
- Verification—ensure that the recommendation aligns with your financial and organizational goals.
The report contains the following sections:
- Virtual guest system name and the date of the last data collection;
- Report description;
- Summary —Provides an overview of the recommendations for the virtual guest;
- System Information—Provides system properties, location, tags, and configuration details for the selected virtual guest;
- Predicted Utilization (All Metrics)—A number of sections that show current resources, workload and predicted utilization charts.
You can scroll through the report or you can click on one of the Details: tabs at the top of the page to jump to the relevant section within the report.
You can access this report by clicking on the system name hyperlink from the virtual guest System Details report.
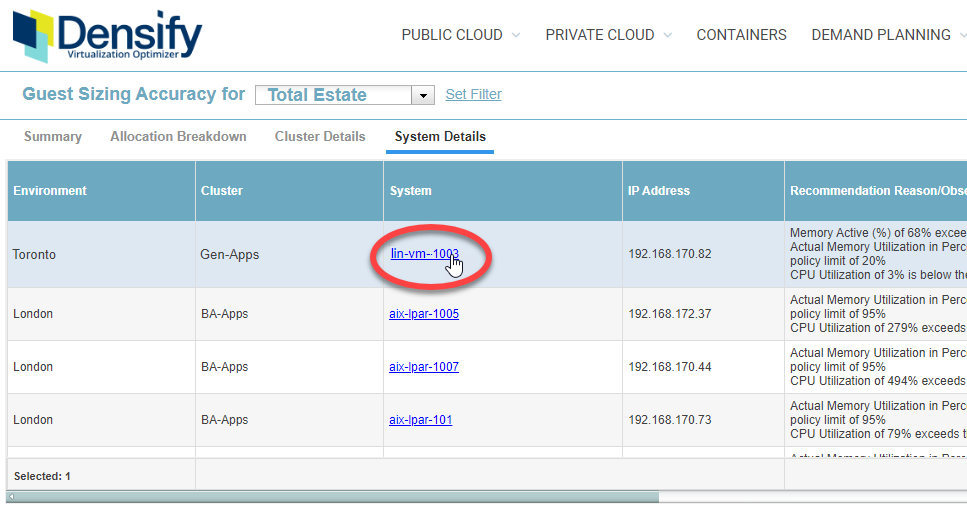
Navigate to the virtual guest System Details report via Private Cloud > Optimization Overview > Guest Sizing Accuracy (click zoom  ) > System Details tab. See
Creating a PDF Version of the Report
You can create a PDF version of the report by clicking the Export to PDF  button located at the top-right corner of the display.
The export file is named "SystemAnalysisVmware.pdf" and is saved to the download folder defined by your browser. You may want to modify the file name to match the selected virtual guest, if you are planning to review and distribute reports for multiple systems.
Summary Table
The summary table identifies the virtual guest and provides an overview of the generated recommendations based on the policy or overrides used.
Table: Summary Report Descriptions
|
Column |
Description |
|---|---|
|
System Name |
The virtual guest system name. |
|
Environment |
The environment to which the virtual guest belongs. An environment is a grouping of virtual guest systems, against which, a set of analyses (as defined by the analysis model) are run in order to generate recommendations. |
|
Cluster |
The cluster containing the virtual guest. |
|
vCenter |
The vCenter or PowerVM containing the virtual guest. |
|
Owner |
The assigned owner for the virtual guest. "-" is displayed if the owner is not assigned. |
|
Application |
The assigned application for the virtual guest. "-" is displayed if the application is not assigned. |
|
Guest OS |
The operating system deployed on the virtual guest. |
|
Recommendation Status |
The overall recommendation status for the virtual guest. The following are the potential recommendation status:
|
|
Recommendation Details |
Detailed description of resource recommendation specifics. |
|
Recommendation Reason/Observations |
The undersized/oversized recommendation reasons, as well as reasons why systems are not analyzed (e.g."Unable to perform Sizing Analysis") or why disk metrics are not available for analysis (e.g. "VMware Tools not running"). In addition, resource observations are listed, comparing resource utilization to the limits specified in the policy. |
|
VM Level Overrides |
If this virtual guest has specific resource overrides, which supersedes the recommendations by Densify, then all the overrides in place are listed. This field is not displayed if there is no override. |
|
Policy |
The Densify policy that is applied to the virtual guest environment. The policy name and a description are provided. |
|
VM Level Policy |
If a policy override is applied to this specific virtual guest, which supersedes the policy listed above, then the override policy name and a description are provided. This field is not displayed if there is no override. |
Optimization Benefits
This section of the summary lists the benefits that can be gained from implementing the recommendation. A list of bullet points maps the values of Recommendation Status to the actual benefits, in terms of both efficiency and performance.
If the Recommendation Status for the selected virtual guest is Just Right, then this section is not displayed.
This table provides the impact to CPU, memory, and disk as percent (%) utilization if you were to implement the recommended resource allocations. A change indicator, the last column, shows you at a glace whether utilization impact is negative, positive, or if there is no impact. This column is shown only if there is at least one resource recommendation.
The System Information table provides the following details of the selected virtual guest.
Table: System Information
|
Column |
Description |
|---|---|
|
System Name |
The virtual guest system name. |
|
OS |
The operating system deployed on the virtual guest. |
|
Environment |
The environment to which the virtual guest belongs. An environment is a grouping of virtual guest systems, against which, a set of analyses (as defined by the analysis model) are run in order to generate recommendations. |
|
Cluster |
The cluster containing the virtual guest. |
|
vCenter |
The vCenter or PowerVM containing the virtual guest. |
|
Department |
These are user-specified attributes that are displayed if the virtual guest has been tagged accordingly. |
|
Location |
|
|
Application |
|
|
Application Tier |
|
|
Operational Environment |
|
|
Security Zone |
|
|
IP Address |
|
|
Host |
|
|
State |
This is the current power state of the guest. This value is only displayed if available. |
Predicted Utilization (All Metrics)
Note: The metrics displayed in the following tables and charts will vary depending on availability for each guest.
Resource Allocation Comparison
This table provides you the comparison of current resource allocations to those of the recommended allocations for the guest. A change indicator in the last column shows you whether allocation recommendations have increased, decreased, or have remained the same. The table below lists the resources for allocation comparison.
|
Resource |
Description |
|---|---|
|
CPU (vCPU) |
The CPU allocation for this virtual guest. |
|
Memory (GB) |
The memory allocation for this virtual guest. |
|
All Disk (GB) |
The total disk allocation for this virtual guest. If current disk allocation is unknown and there is no recommended allocation, then this row is not displayed. |
If the recommended allocations are the same as the current allocations, then the Recommended and Change columns are not displayed.
Disk Allocation Increase Recommendations
This table is displayed only if there is a recommended increase in a particular disk volume. A change indicator in the last column shows you, at a glance, the amount of increased disk space required.
Resource Utilization Impact
This table provides the impact to CPU utilization, memory utilization, as well as to network and disk IO throughput if you were to implement the recommended resource allocations. A change indicator, in the last column, shows you at a glance whether utilization impact is negative, positive or if there is no impact and utilization remains the same as compared to the current resource allocation. This column is shown only if there is a resource allocation recommendation.
|
Utilization Metric |
Description |
|---|---|
|
CPU Utilization (%) |
This is the CPU utilization as percentage of the total available CPU cycles. |
|
Actual Memory Utilization (%) |
This is the memory consumed by the VM, as percentage of the total available memory, and does not include any overhead memory allocated outside of the guest OS. For VMware, this value is calculated from the vSphere "VM Memory Consumed" metric. |
|
Active Memory Usage (%) |
This is the active memory used at any given period of time, as percentage of the total available memory. For VMware, this is taken from the vSphere "Active Memory" metric and can also be backfilled by "Guest Needed Memory" from vROPs, if Active Memory is not available. |
|
Memory Required (%) |
This is Densify's predicted memory required by the VM to operate normally. This value is calculated based on the VM's active/actual memory, total memory allocation, age, and other factors, including the policy applied. |
|
Network IO Throughput (MB/s) |
This is the network throughput in MB/s. |
|
Network IO (pkts/s) |
This is the network I/O in pkts/s. |
|
Disk IO Throughput (MB/s) |
This is the disk throughput in MB/s. |
|
Disk IO Operations (IOPS) |
This is the disk I/O in ops/s. |
If the utilization metric percentage is not available, then the metric row is not displayed.
If the recommended allocations are the same as the current allocations, then the Recommended and Change columns are not displayed.
Workload Charts
The following workload charts are provided so you can compare utilization with the current resource allocation against that of the recommended resource allocation for the virtual guest. The charts for the current allocations are shown on the left side and the charts for the recommended allocations are shown on the right side. Charts are displayed based on availability of metrics:
- If utilization metrics are not available, the corresponding chart is not displayed.
- Only the current utilization charts are shown for virtual guests that are right sized (i.e. identified as "Just Right").
- When actual memory data is not collected, and memory workloads are backfilled with the memory usage as defined by the policy, no recommended memory workload chart is displayed.
The Utilization Metrics: Checked for Over-allocated Resources using Low Limit tab displays utilization charts with the lower limits of the policy, exposing over-allocated resources.
Table: Utilization Metrics: Checked for Over-allocated Resources using Low Limits
|
Current and Recommended Charts |
Current Charts |
|---|---|
|
Utilization charts for both current and recommended resource allocations, showing the lower limits of the policy are provided for the following metrics:
|
Workload charts for only the current resource allocated guest are provided for the following metrics:
|
The Utilization Metrics: Checked for Under-allocated Resources using High Limit tab displays utilization charts with the higher limits of the policy, exposing under-allocated resources.
Table: Utilization Metrics: Checked for Under-allocated Resources using High Limits
|
Current and Recommended Charts |
Current Charts |
|---|---|
|
Utilization charts for both current and recommended resource allocations, showing the higher limits of the policy are provided for the following metrics:
|
Workload charts for only the current instance type are provided for the following metrics:
|